Click here to open this guide in a new browser tab. You can also click here to open the video guide on Statistics.
This guide will show you how to use the Statistics page to find the number of scans you received during your event.
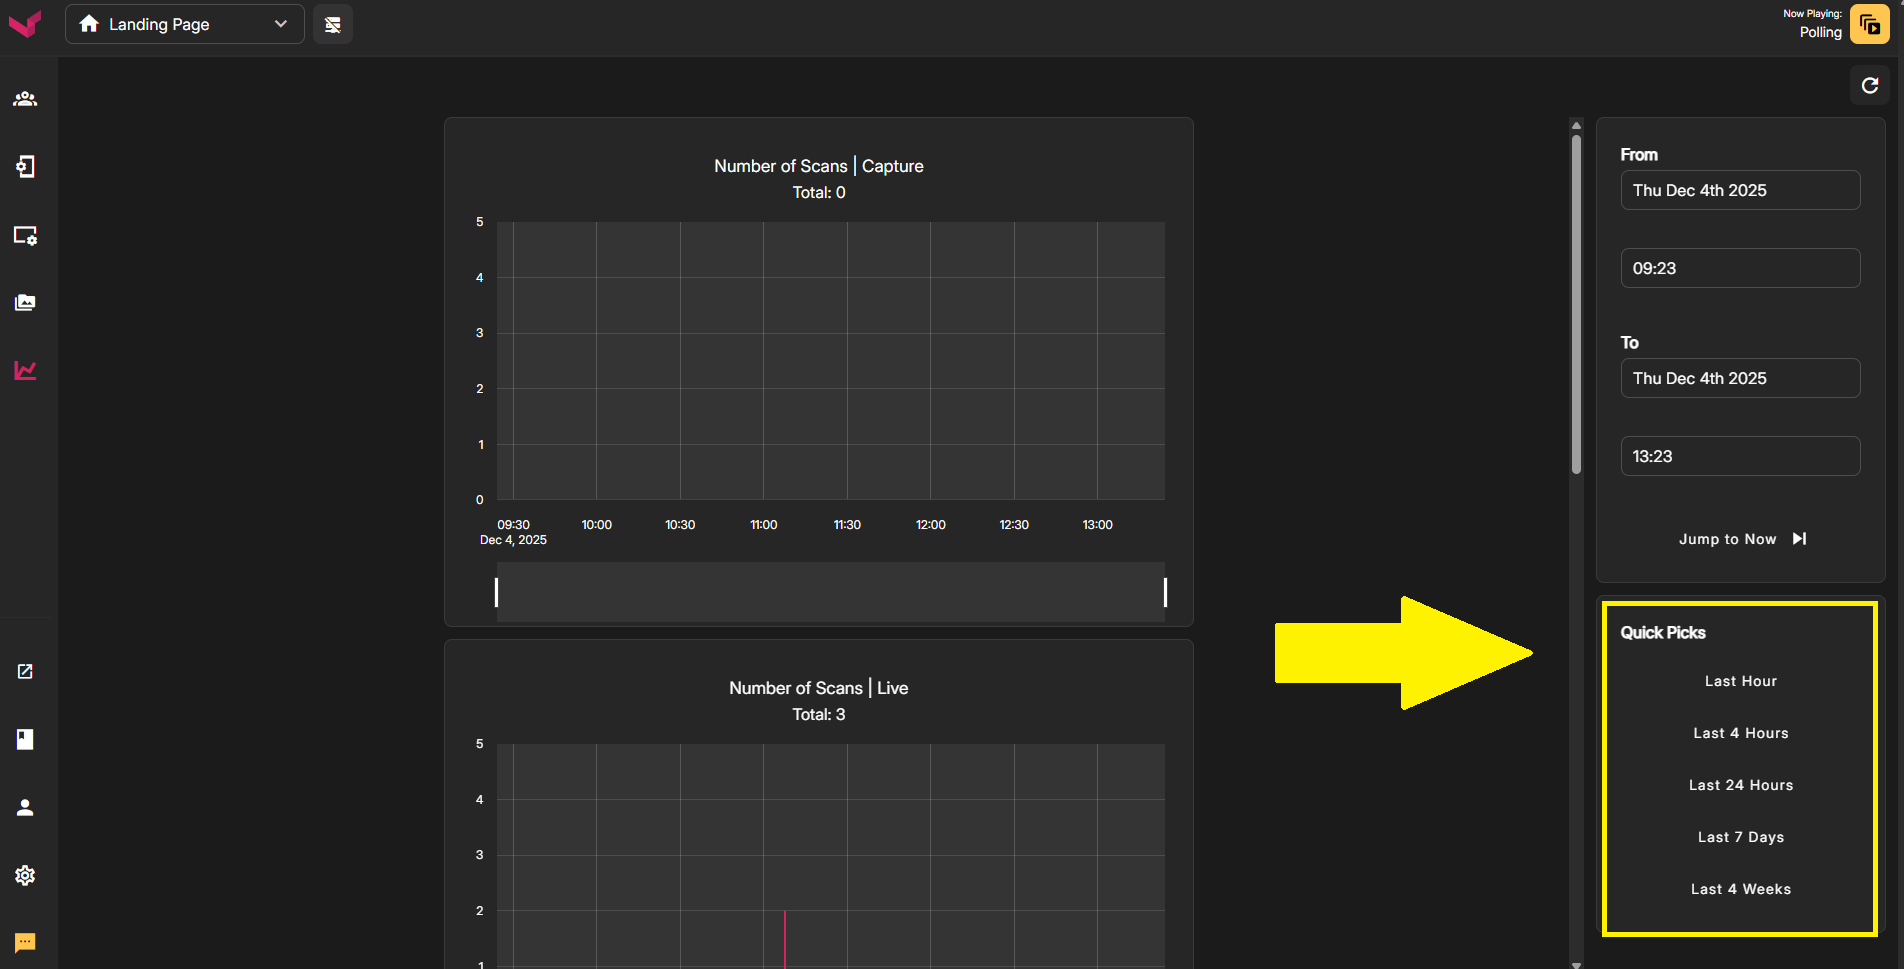
The statistics page can be found in the Left Nav. On that page in the right column is where you'll specify the time range that you want to check. You'll enter a Starting Date & Time, and then an End Date & Time.

Instead of manually typing a Date & Time range, you can use the Quick Picks in the lower section. These will auto-populate the time frame above with commonly used time periods. For example, if you want to check the number of scans for a game that has just ended, you can simply click "Last 4 Hours" to lock-in that time period. If you wanted to check scans from yesterday, simply click "Last 24 Hours" to view that time frame.
Once you've specific a Time & Date range in the right column, the number of scans for each app will be displayed. You'll see your scan numbers at the top of each graph.
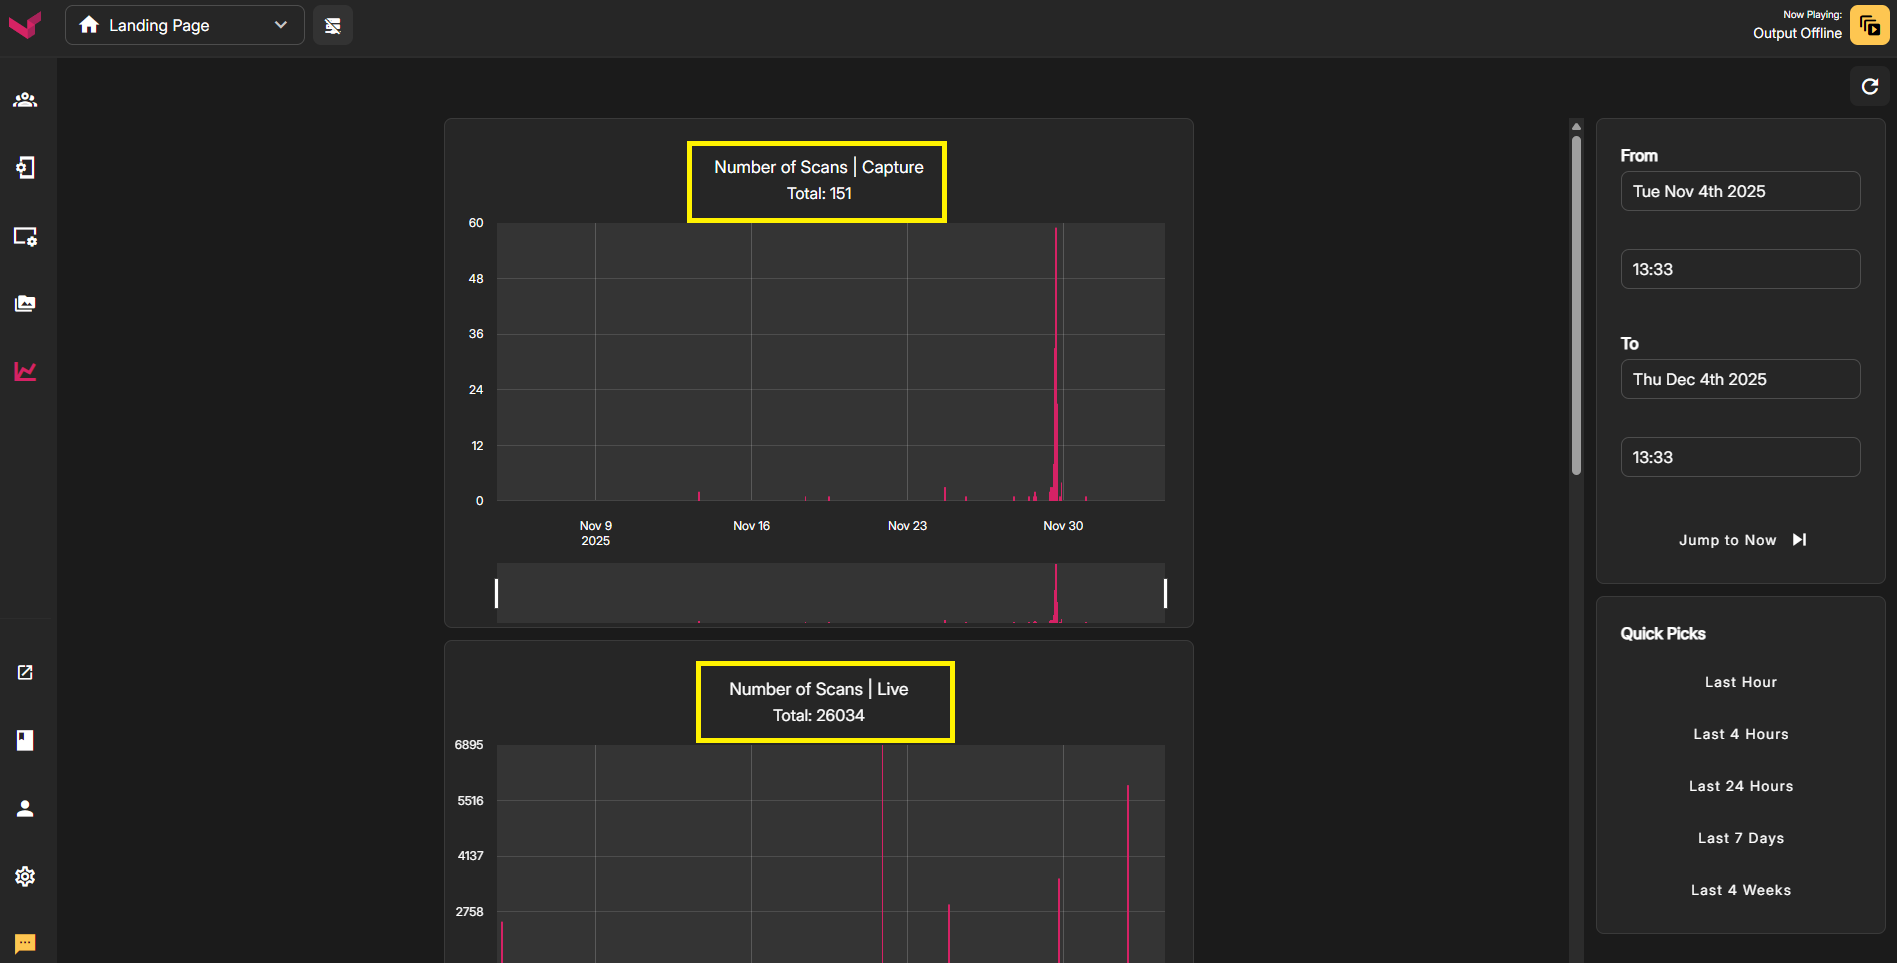
Once you're seeing results in the graphs, you can zoom in even further to see more precise information, down to the minute. For any section of the graph you want to zoom: left click the mouse, drag across the section of the graph to highlight it, and release the mouse button. You can later cancel the zoom by double clicking the graph.
Was this article helpful?
That’s Great!
Thank you for your feedback
Sorry! We couldn't be helpful
Thank you for your feedback
Feedback sent
We appreciate your effort and will try to fix the article